CoolClimate Maps
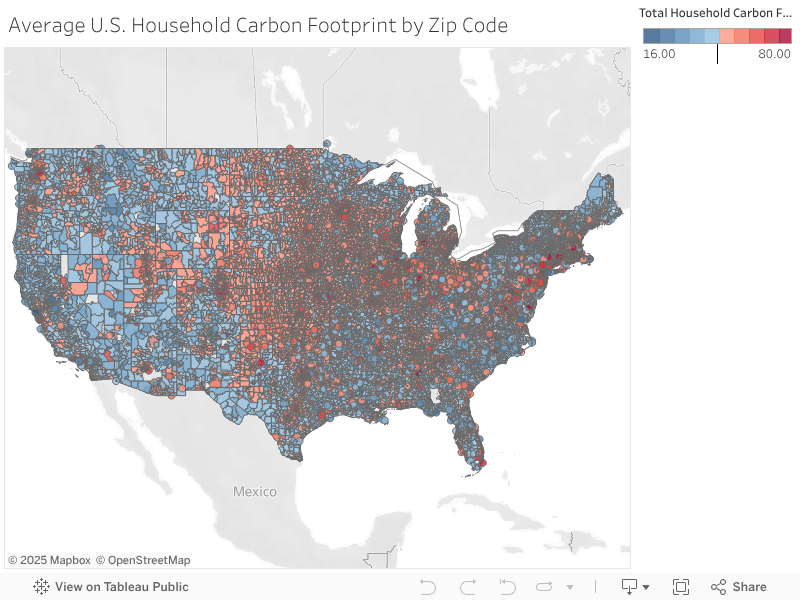
Average U.S. Household Carbon Footprints
Data are from the following paper:
Christopher M. Jones and Daniel M. Kammen, Spatial Distribution of U.S. Household Carbon Footprints Reveals Suburbanization Undermines Greenhouse Gas Benefits of Urban Population Density. Environ. Sci. Technol., 2013, dx.doi.org/10.1021/es4034364. See our FAQ. For a free copy of the paper first create an ACS account and then click here to download the paper. Visit our Data Request Page to download the data.
Average Household Carbon Footprint - Eastern United States
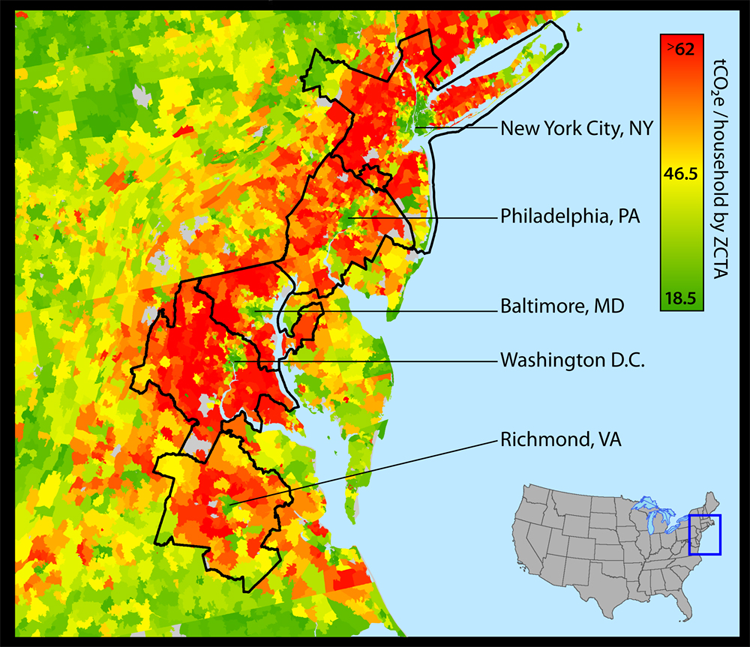
Transportation Carbon Footprint - New York Metropolitan Area
![]()
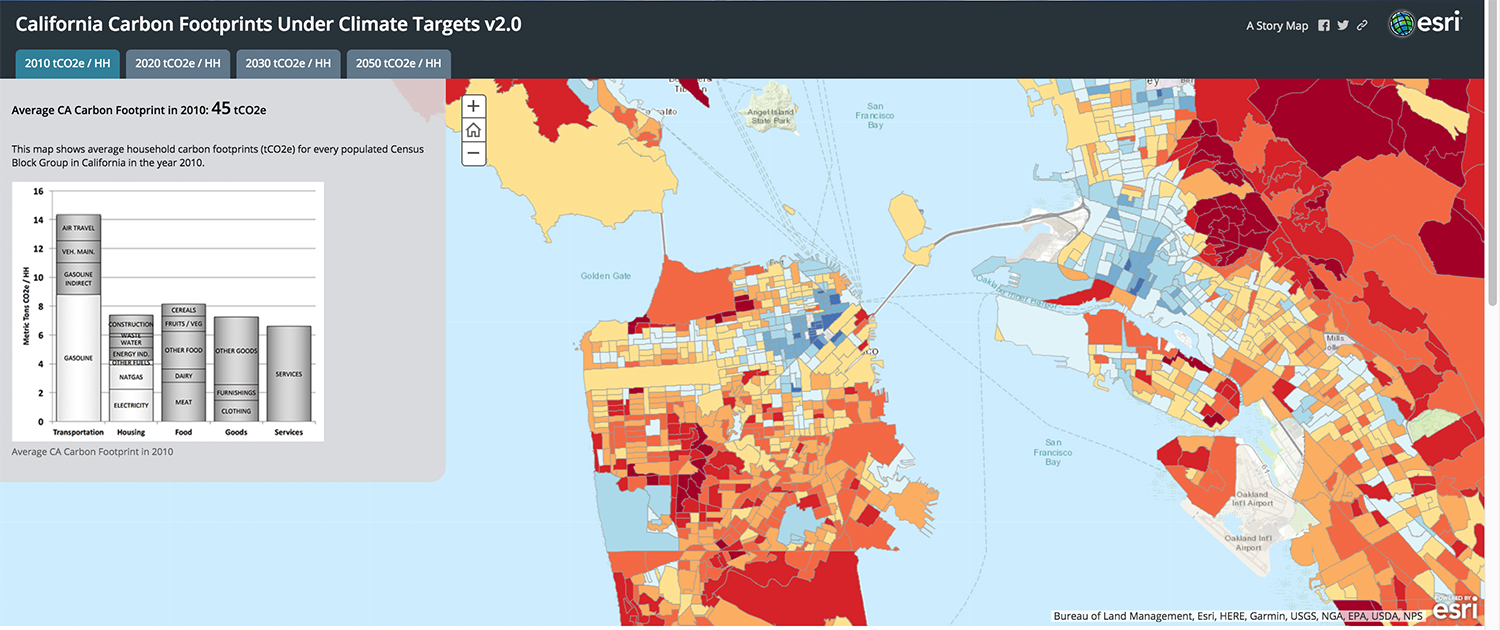
California Scenarios Tool Map
Data are from the following paper:
Christopher M. Jones , Stephen M Wheeler, and Daniel M. Kammen, Carbon Footprint Planning: Quantifying Local and State Mitigation Opportunities for 700 California Cities. Urban Planning.Vol3, No2, 2018, dx.doi.org/10.17645/up.v3i2.1218.
Sponsoring organizations:
Renewable and Appropriate Energy Laboratory
California Air Resources Board
National Science Foundation
Using the Map Data
These maps are available for free for non-profit use, if cited properly. Required minimum citation includes the source name, map name, year published, and links back to project page (or displays url). Example: "Source: UC Berkeley CoolClimate Network, Average Annual Household Carbon Footprint (2013)." If you are interested in obtaining a spreadsheet with detailed model results, please review and complete the CoolClimate Data Request Form. Once projects are completed please fill out the CoolClimate Completed Projects Form.